Eat Well Without Guesswork
Score any recipe for blood sugar, sodium, and nutrient quality — powered by USDA data.
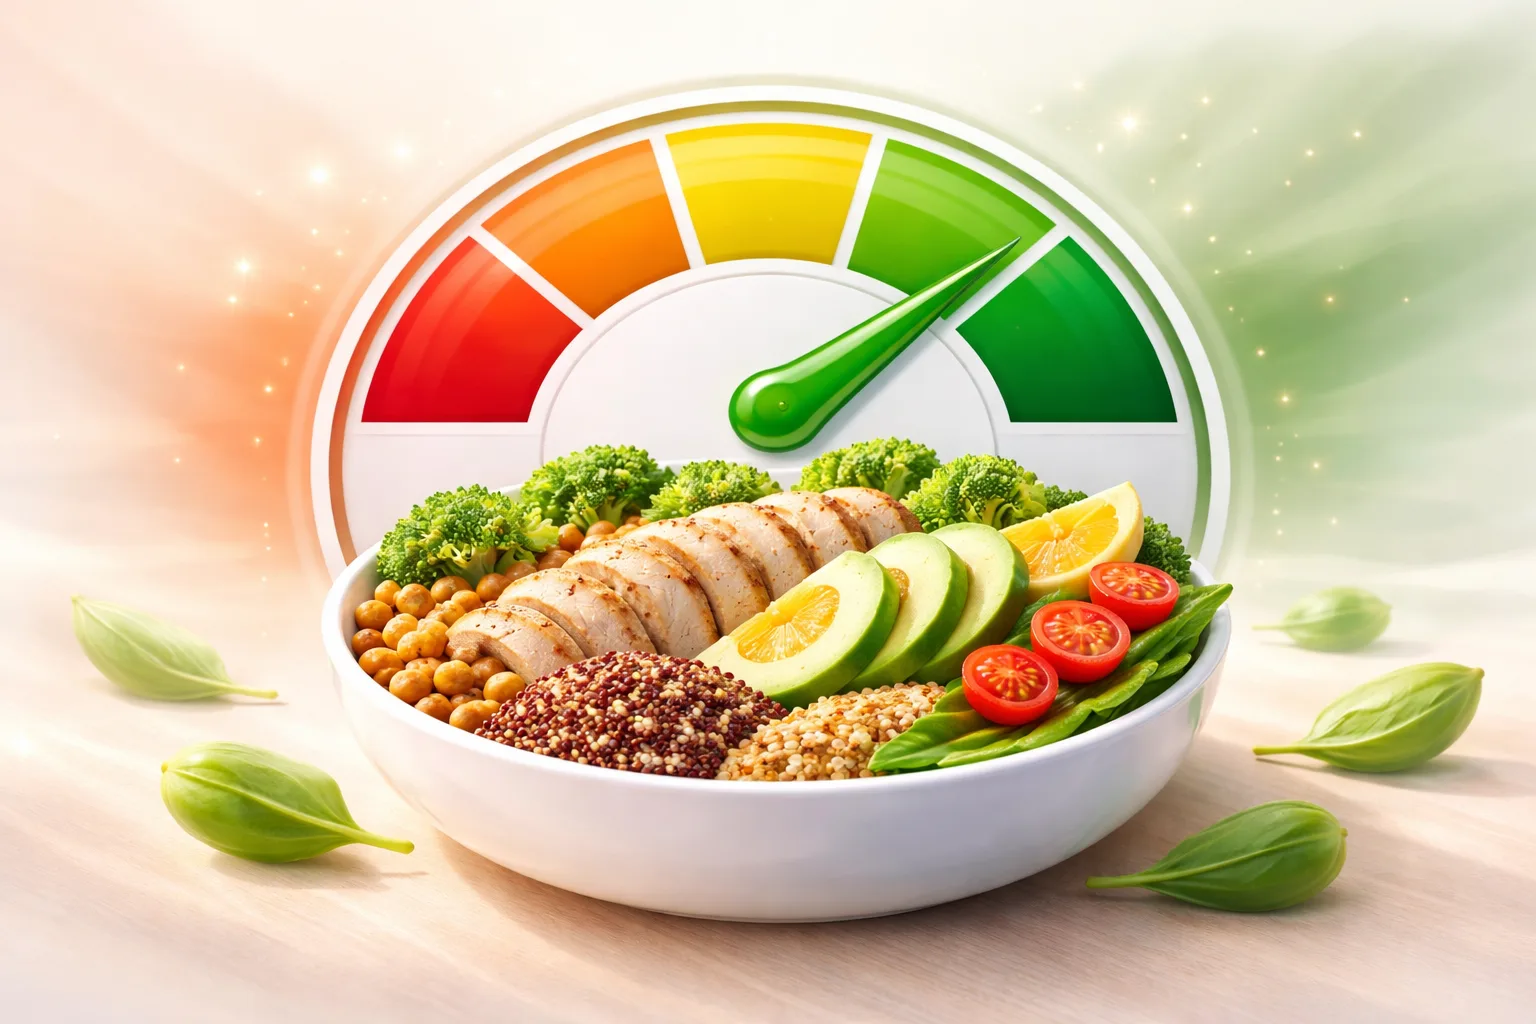
Score a Recipe
Paste any recipe's ingredient list and get a full health score breakdown.
Try it free →
Score by Nutrition
Enter nutrition values for any recipe and get a health score breakdown.
Try it free →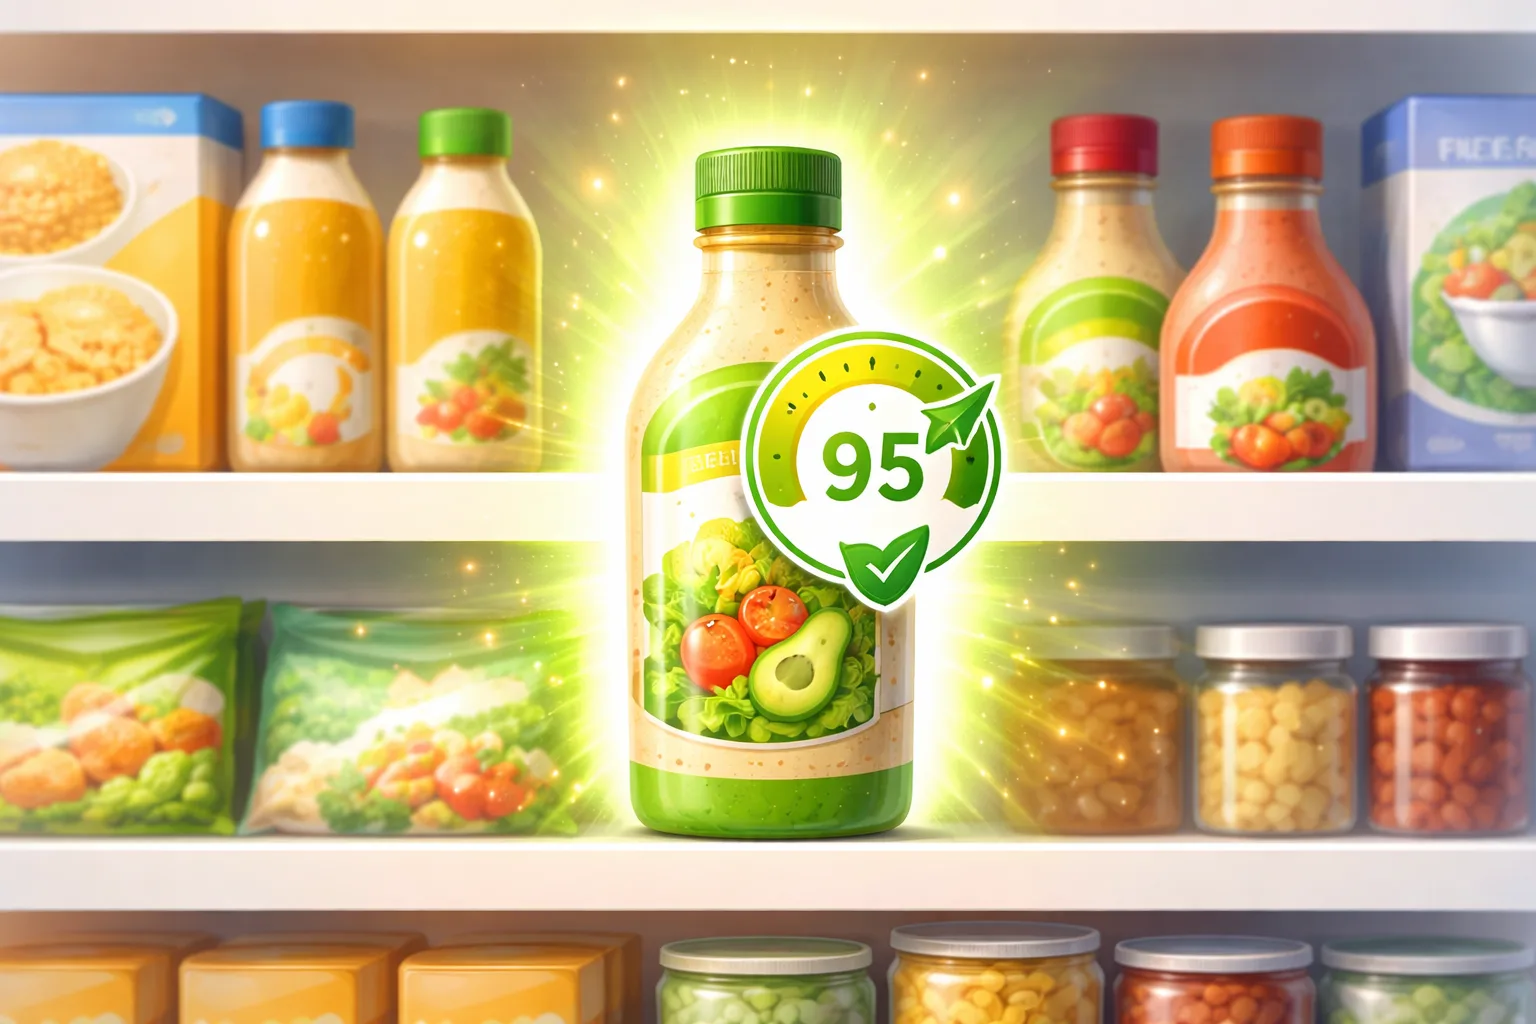
Shopping Guides
Data-driven grocery picks ranked by real nutrition criteria.
Browse guides →See the Difference
Same tool, very different scores. Click any card to see why.
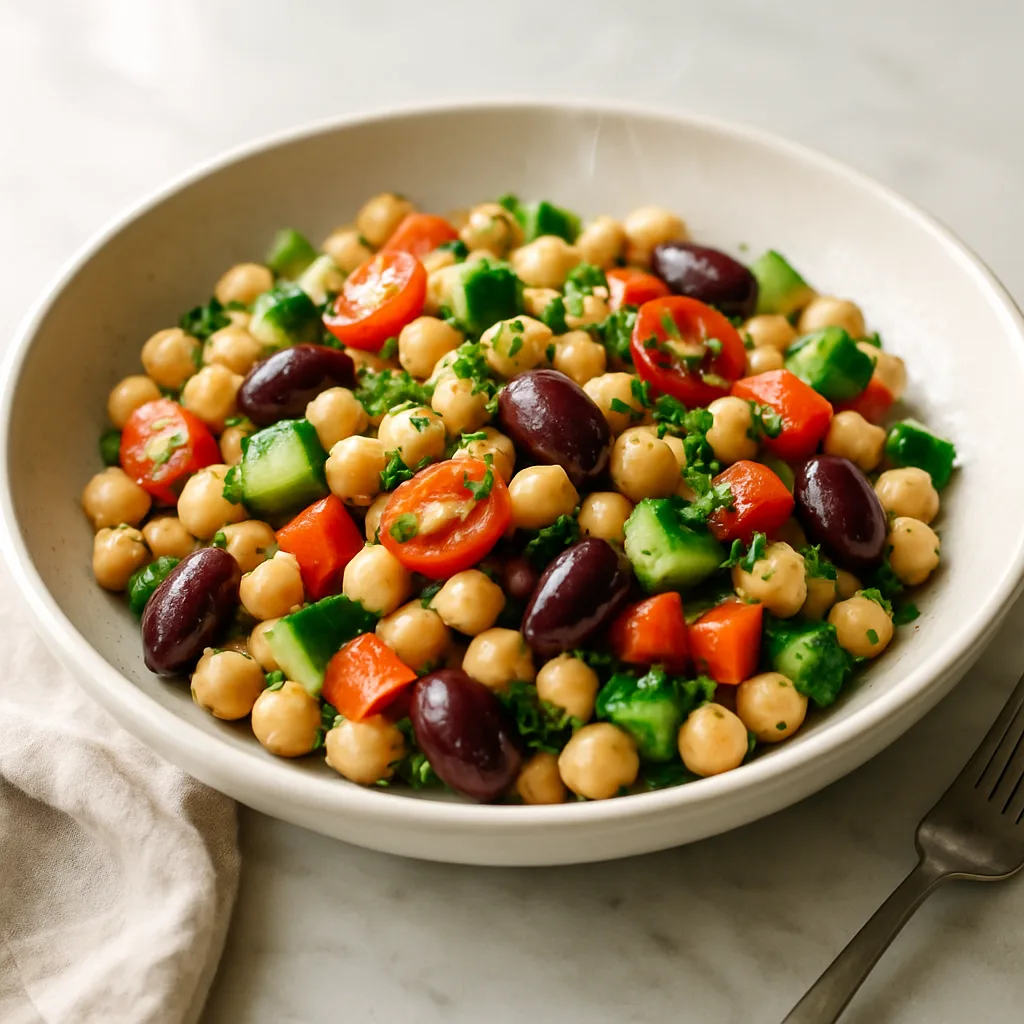
Chickpea Salad
88
Blood Sugar
100
Sodium
88
Nutrients
Ingredients:
1.5 cups canned chickpeas, 1 large cucumber, diced, 1 cup cherry tomatoes, halved, 1 medium red bell pepper, diced, 0.25 cup red onion, finely diced, 2 tbsp kalamata olives, halved, 0.25 cup fresh parsley, chopped, 2 tbsp extra virgin olive oil, 2 tbsp lemon juice, 1 tbsp red wine vinegar, 1 clove garlic, minced, 1 tsp dried oregano, 0.5 tsp cumin, 0.25 tsp salt, 0.25 tsp black pepper
View full recipe →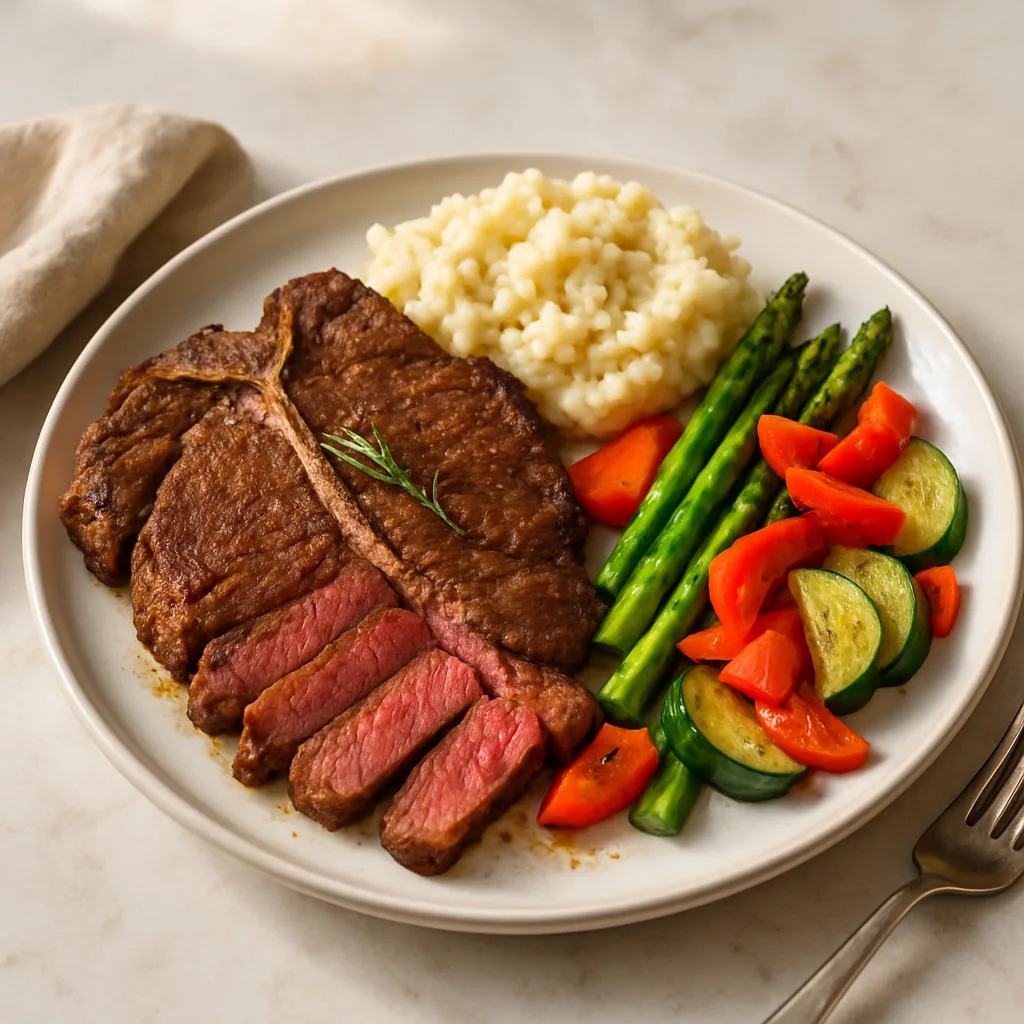
T-Bone Steak Dinner
79
Blood Sugar
93
Sodium
88
Nutrients
Ingredients:
800g t-bone steak, 600g yukon gold potato, 250g asparagus, 1 medium red bell pepper, 1 medium zucchini, 2 tbsp olive oil, 2 tbsp butter, 0.25 cup whole milk, 6 cloves garlic, 1 tbsp fresh rosemary, 1 tsp dried thyme, 0.5 tsp table salt, 0.25 tsp black pepper
View full recipe →
Frozen Pepperoni Pizza
71
Blood Sugar
42
Sodium
70
Nutrients
Nutrition (half pizza):
Based on typical frozen pepperoni pizza nutrition data

Fast Food Cheeseburger
83
Blood Sugar
58
Sodium
71
Nutrients
Nutrition (per burger):
Based on typical fast food cheeseburger nutrition data
Nutrition Scoring That Goes Beyond Calories
A calorie count tells you how much energy a meal carries — but almost nothing about how it actually affects your body. A dish can be low in calories yet spike your blood sugar, high in protein yet loaded with sodium, or labeled "heart-healthy" while built on refined carbohydrates. Spoonalytics looks past the single number on the front of the package and rates food on the three dimensions that research most closely ties to long-term health.
Every food you enter is scored from 0 to 100 across blood sugar stability (how steeply it raises blood glucose), sodium balance (how its salt load compares to heart-healthy limits), and nutrient quality (how much real nourishment — fiber, protein, healthy fats, and micronutrients — it delivers). Those three combine into one overall health score, and each is shown on its own so you can see exactly where a meal shines and where it falls short. The numbers come straight from the USDA FoodData Central database, the same source used by researchers and government agencies, and the full methodology is public.
We do the math
Amounts are converted to grams, looked up in USDA data, and run through the scoring algorithm — in seconds.
See your score
Get an overall score, the three-pillar breakdown, and specific tips on what to change to improve it.
It's built for real life — whether you're keeping an eye on blood sugar, watching your sodium for heart health, planning a week of meals, or just curious whether tonight's dinner is as healthy as it looks. There's no sign-up required to score a meal, and no brand pays to influence a result: the same recipe earns the same score no matter who made it. You can read more about why and how this tool was built on the about page.
Don't feel like scoring your own? Browse 100+ pre-scored recipes you can filter by sodium, sugar, and difficulty, or dig into the data-driven grocery shopping guides that rank everyday products like yogurt, bread, and snack bars by real nutrition criteria.
How the Scoring Works
Every food gets three scores, calculated from real USDA nutrition data.
Overall Health
A weighted average of nutrient density, fiber, and ingredient quality. The higher the score, the better the fuel.
Blood Sugar Impact
We calculate the glycemic response of each meal to help you avoid spikes and maintain steady energy levels.
Sodium Density
Heart-healthy focus. We flag high-sodium ingredients and suggest lower-salt alternatives that don't sacrifice flavor.
What the Scores Mean
| Score | Rating | What It Means |
|---|---|---|
| 90–100 | Excellent | Nutrient-dense, well-balanced — eat freely |
| 75–89 | Good | Solid everyday choice with minor trade-offs |
| 60–74 | Fair | OK occasionally — could use improvement in one or more areas |
| Below 60 | Poor | Significant nutritional concerns — best reserved for rare treats |
100+ Healthy Recipes, All Scored
Every recipe in our library is scored for blood sugar, sodium, and nutrient quality.